Simple Data-Exploration
Example showing some possibilities of data exploration (i.e. to ‘smell’ data).
from mvpa2.suite import *

# load example fmri dataset
ds = load_example_fmri_dataset()

# only use the first 5 chunks to save some cpu-cycles
ds = ds[ds.chunks < 5]
It is always useful to have a quick look at the summary of the dataset and verify that statistics (mean, standard deviation) are in the expected range, that there is balance among targets/chunks, and that order is balanced (where appropriate).
print ds.summary()
Now we can take a look at the distribution of the feature values in all sample categories and chunks.
pl.figure(figsize=(14, 14)) # larger figure
hist(ds, xgroup_attr='chunks', ygroup_attr='targets', noticks=None,
bins=20, normed=True)
# next only works with floating point data
ds.samples = ds.samples.astype('float')
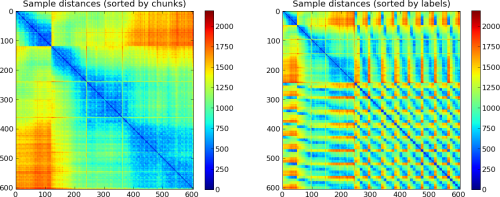
# look at sample similarity
# Note, the decreasing similarity with increasing temporal distance
# of the samples
pl.figure(figsize=(14, 6))
pl.subplot(121)
plot_samples_distance(ds, sortbyattr='chunks')
pl.title('Sample distances (sorted by chunks)')
# similar distance plot, but now samples sorted by their
# respective targets, i.e. samples with same targets are plotted
# in adjacent columns/rows.
# Note, that the first and largest group corresponds to the
# 'rest' condition in the dataset
pl.subplot(122)
plot_samples_distance(ds, sortbyattr='targets')
pl.title('Sample distances (sorted by targets)')
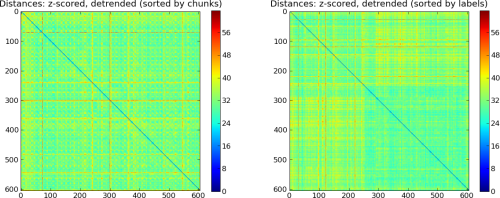
# z-score features individually per chunk
print 'Detrending data'
poly_detrend(ds, polyord=2, chunks_attr='chunks')
print 'Z-Scoring data'
zscore(ds)
pl.figure(figsize=(14, 6))
pl.subplot(121)
plot_samples_distance(ds, sortbyattr='chunks')
pl.title('Distances: z-scored, detrended (sorted by chunks)')
pl.subplot(122)
plot_samples_distance(ds, sortbyattr='targets')
pl.title('Distances: z-scored, detrended (sorted by targets)');
# XXX add some more, maybe show effect of preprocessing
Outputs of the example script. Data prior to preprocessing
Data after minimal preprocessing
See also
The full source code of this example is included in the PyMVPA source distribution (doc/examples/smellit.py).