Visualization of Data Projection Methods
from mvpa2.support.pylab import pl
from mvpa2.misc.data_generators import noisy_2d_fx
from mvpa2.mappers.svd import SVDMapper
from mvpa2.mappers.mdp_adaptor import ICAMapper, PCAMapper
from mvpa2 import cfg

center = [10, 20]
axis_range = 7

##REF: Name was automagically refactored
def plot_proj_dir(p):
    pl.plot([0, p[0,0]], [0, p[0,1]],
           linewidth=3, hold=True, color='y')
    pl.plot([0, p[1,0]], [0, p[1,1]],
           linewidth=3, hold=True, color='k')

mappers = {
            'PCA': PCAMapper(),
            'SVD': SVDMapper(),
            'ICA': ICAMapper(alg='CuBICA'),
          }
datasets = [
    noisy_2d_fx(100, lambda x: x, [lambda x: x],
                center, noise_std=0.5),
    noisy_2d_fx(50, lambda x: x, [lambda x: x, lambda x: -x],
                center, noise_std=0.5),
    noisy_2d_fx(50, lambda x: x, [lambda x: x, lambda x: 0],
                center, noise_std=0.5),
   ]

ndatasets = len(datasets)
nmappers = len(mappers.keys())

pl.figure(figsize=(8,8))
fig = 1

for ds in datasets:
    for mname, mapper in mappers.iteritems():
        mapper.train(ds)

        dproj = mapper.forward(ds.samples)
        mproj = mapper.proj
        pl.subplot(ndatasets, nmappers, fig)
        if fig <= 3:
            pl.title(mname)
        pl.axis('equal')

        pl.scatter(ds.samples[:, 0] - center[0],
                  ds.samples[:, 1] - center[1],
                  s=30, c=(ds.sa.targets) * 200)
        plot_proj_dir(mproj)
        fig += 1
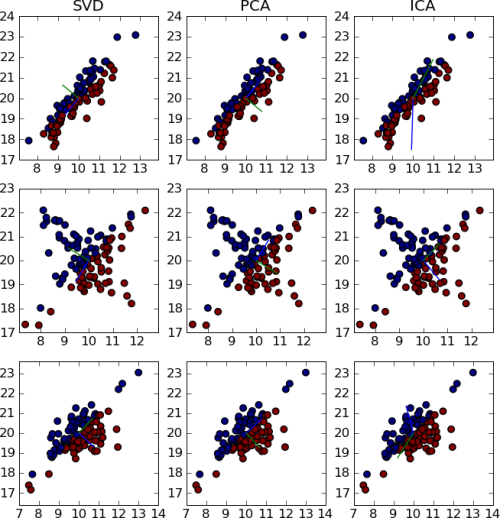
Output of the example:
See also
The full source code of this example is included in the PyMVPA source distribution (doc/examples/projections.py).