Determine the Distribution of some Variable
This is an example demonstrating discovery of the distribution facility.
from mvpa2.suite import *

verbose.level = 2
if __debug__:
    # report useful debug information for the example
    debug.active += ['STAT', 'STAT_']
While doing distribution matching, this example also demonstrates infrastructure within PyMVPA to log a progress report not only on the screen, but also into external files, such as
- simple text file,
- PDF file including all text messages and pictures which were rendered.
For PDF report you need to have reportlab external available.
report = Report(name='match_distribution_report',
title='PyMVPA Example: match_distribution.py')
verbose.handlers += [report] # Lets add verbose output to the report.
# Similar action could be done to 'debug'
# Also append verbose output into a log file we care about
verbose.handlers += [open('match_distribution_report.log', 'a')]
#
# Figure for just normal distribution
#
# generate random signal from normal distribution
verbose(1, "Random signal with normal distribution")
data = np.random.normal(size=(1000, 1))
# find matching distributions
# NOTE: since kstest is broken in older versions of scipy
# p-roc testing is done here, which aims to minimize
# false positives/negatives while doing H0-testing
test = 'p-roc'
figsize = (15, 10)
verbose(1, "Find matching datasets")
matches = match_distribution(data, test=test, p=0.05)
pl.figure(figsize=figsize)
pl.subplot(2, 1, 1)
plot_distribution_matches(data, matches, legend=1, nbest=5)
pl.title('Normal: 5 best distributions')
pl.subplot(2, 1, 2)
plot_distribution_matches(data, matches, nbest=5, p=0.05,
tail='any', legend=4)
pl.title('Accept regions for two-tailed test')
# we are done with the figure -- add it to report
report.figure()
#
# Figure for fMRI data sample we have
#
verbose(1, "Load sample fMRI dataset")
dataset = load_example_fmri_dataset()
# select random voxel
dataset = dataset[:, int(np.random.uniform()*dataset.nfeatures)]
verbose(2, "Minimal preprocessing to remove the bias per each voxel")
poly_detrend(dataset, chunks_attr='chunks', polyord=1)
zscore(dataset, chunks_attr='chunks', param_est=('targets', ['0']),
dtype='float32')
# on all voxels at once, just for the sake of visualization
data = dataset.samples.ravel()
verbose(2, "Find matching distribution")
matches = match_distribution(data, test=test, p=0.05)
pl.figure(figsize=figsize)
pl.subplot(2, 1, 1)
plot_distribution_matches(data, matches, legend=1, nbest=5)
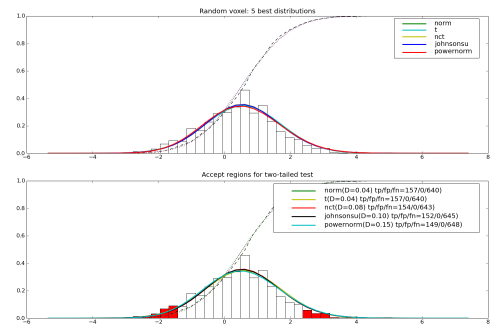
pl.title('Random voxel: 5 best distributions')
pl.subplot(2, 1, 2)
plot_distribution_matches(data, matches, nbest=5, p=0.05,
tail='any', legend=4)
pl.title('Accept regions for two-tailed test')
report.figure()
Example output for a random voxel is
See also
The full source code of this example is included in the PyMVPA source distribution (doc/examples/match_distribution.py).