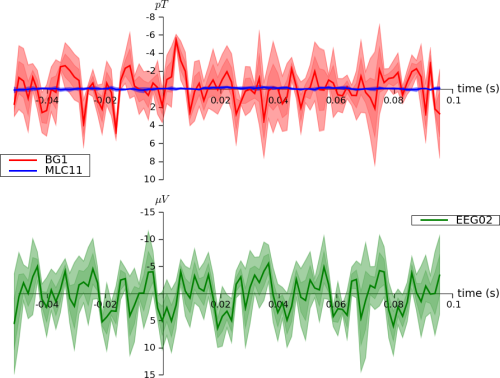
ERP/ERF-Plots
Example demonstrating an ERP-style plots. Actually, this code can be used to plot various time-locked data types. This example uses MEG data and therefore generates an ERF-plot.
from mvpa2.suite import *

# load data
meg = TuebingenMEG(os.path.join(pymvpa_dataroot, 'tueb_meg.dat.gz'))


# Define plots for easy feeding into plot_erp
plots = []
colors = ['r', 'b', 'g']

# figure out pre-stimulus onset interval
t0 = -meg.timepoints[0]

plots = [ {'label' : meg.channelids[i],
           'color' : colors[i],
           'data' : meg.data[:, i, :]}
          for i in xrange(len(meg.channelids)) ]

# Common arguments for all plots
cargs = {
    'SR' : meg.samplingrate,
    'pre_onset' : t0,
    # Plot only 50ms before and 100ms after the onset since we have
    # just few trials
    'pre' : 0.05, 'post' : 0.1,
    # Plot all 'errors' in different degrees of shadings
    'errtype' : ['ste', 'ci95', 'std'],
    # Set to None if legend manages to obscure the plot
    'legend' : 'best',
    'alinewidth' : 1  # assume that we like thin lines
    }

# Create a new figure
fig = pl.figure(figsize=(12, 8))

# Following plots are plotted inverted (negative up) for the
# demonstration of this capability and elderly convention for ERP
# plots. That is controlled with ymult (negative gives negative up)


# Plot MEG sensors

# frame_on=False guarantees abent outside rectangular axis with
# labels. plot_erp recreates its own axes centered at (0,0)
ax = fig.add_subplot(2, 1, 1, frame_on=False)
plot_erps(plots[:2], ylabel='$pT$', ymult=-1e12, ax=ax, **cargs)

# Plot EEG sensor
ax = fig.add_subplot(2, 1, 2, frame_on=False)
plot_erps(plots[2:3], ax=ax, ymult=-1e6, **cargs)

# Additional example: plotting a single ERP on an existing plot
# without drawing axis:
#
# plot_erp(data=meg.data[:, 0, :], SR=meg.samplingrate, pre=pre,
#         pre_mean=pre, errtype=errtype, ymult=-1.0)
The ouput of the provided example is presented below. It is not a very fascinating one due to the limited number of samples provided in the dataset shipped within the toolbox.
See also
The full source code of this example is included in the PyMVPA source distribution (doc/examples/erp_plot.py).