Generating Topography plots
Example demonstrating a topography plot.
from mvpa2.suite import *
# Sanity check if we have griddata available
externals.exists("griddata", raise_=True)
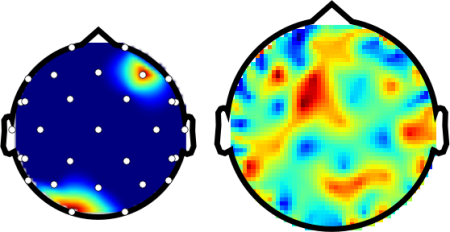
# EEG example splot
pl.subplot(1, 2, 1)
# load the sensor information from their definition file.
# This file has sensor names, as well as their 3D coordinates
sensors=XAVRSensorLocations(os.path.join(pymvpa_dataroot, 'xavr1010.dat'))
# make up some artifical topography
# 'enable' to channels, all others set to off ;-)
topo = np.zeros(len(sensors.names))
topo[sensors.names.index('O1')] = 1
topo[sensors.names.index('F4')] = 1
# plot with sensor locations shown
plot_head_topography(topo, sensors.locations(), plotsensors=True)
# MEG example plot
pl.subplot(1, 2, 2)
# load MEG sensor locations
sensors=TuebingenMEGSensorLocations(
os.path.join(pymvpa_dataroot, 'tueb_meg_coord.xyz'))
# random values this time
topo = np.random.randn(len(sensors.names))
# plot without additional interpolation
plot_head_topography(topo, sensors.locations(),
interpolation='nearest')
The ouput of the provided example should look like
See also
The full source code of this example is included in the PyMVPA source distribution (doc/examples/topo_plot.py).